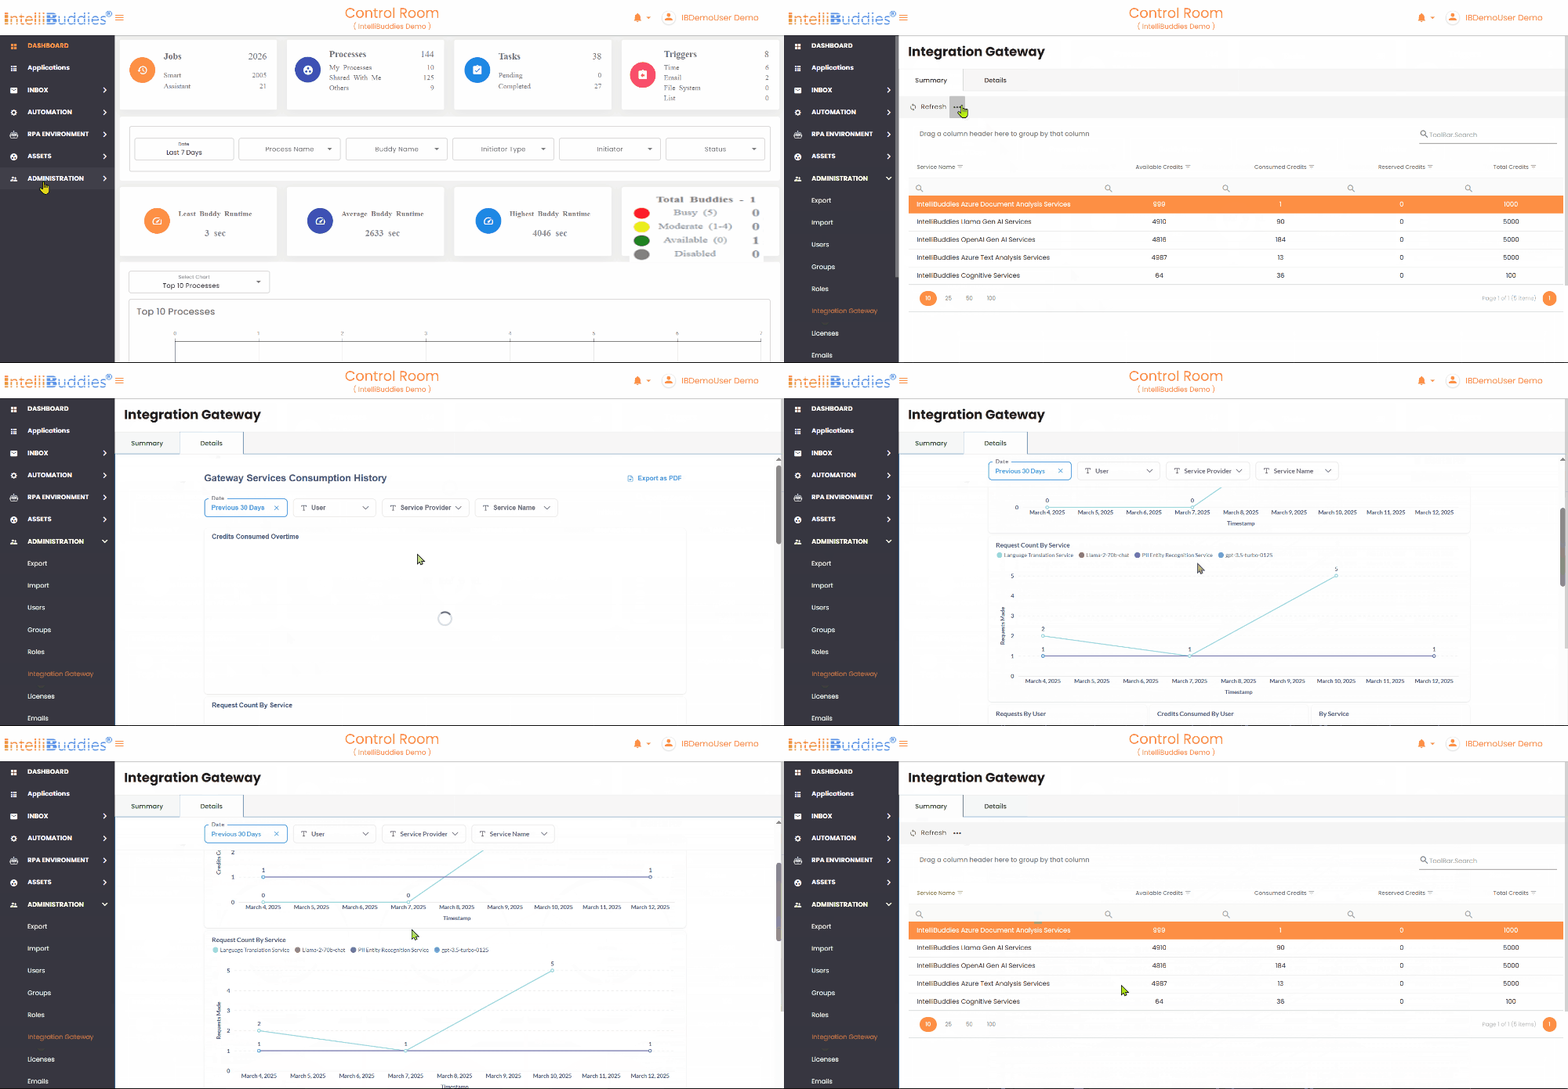
Integration Gateway Credit Summary
This page inside the AI Command Center contains the credit usage summary for all purchased Integration Gateway Services under your current Enterprise Subscription. Only users granted the Administration role can access this page.
Tabs Overview
The Integration Gateway Credit Summary page features two organized tabs:
| Options | Description |
|---|---|
| Summary | Displays the names of the purchased services, providing a quick credit consumption summary. |
| Details | Provides a comprehensive historical breakdown of credit consumption, allowing users to track usage patterns and analyze resource allocation over time. |
Summary Tab
The Summary tab provides a concise overview of credit allocation and usage, enabling administrators to monitor available and consumed credits efficiently.
The following table provides details about the credit summary grid:
| Columns | Description |
|---|---|
| Service Name | Displays the name of the purchased service SKU. |
| Available Credits | Indicates the number of credits currently available for use. |
| Consumed Credits | Shows the number of credits already utilized. |
| Reserved Credits | Reserved Credits represent the credits temporarily held when a request is initiated. These credits remain reserved until the request is processed. The corresponding credits are deducted once the request is successfully handled, and the reservation is cleared. If an error occurs during processing, the reserved credits are reset based on the final status of the request at the end of the day, ensuring accurate credit management. |
| Total Credits | Displays the total number of credits purchased. |
Details Tab
The Details tab provides a comprehensive overview of credit consumption history, enabling administrators to monitor, track, and analyze credit usage trends over time for better resource management and planning.
Integration Gateway Consumption History
This section offers comprehensive logs detailing consumed credits' timing and usage. It presents information in structured data tables and graphical formats, including charts and trends, to facilitate thorough credit utilization auditing, monitoring, and analysis. These visual and data-driven insights help administrators track usage patterns, identify anomalies, and optimize resource allocation effectively.
